
1. Widget 배치
원래 FM 개발 순서가 어떻게 되는지는 모르겠지만, 우선적으로 나는 GUI를 배치하고 시작한다.
사실 정식으로 배워본 적은 없어 구글링을 기반으로 개발을 진행했다. 구글에 ‘Python PyQt5 ~~’로 검색을 하면 많은 정보를 얻을 수 있다. 이런저런 정보를 찾다 보니 Widget 위치 배열은 Layout으로 하는 것이 맞다고 한다. 자세히는 모르지만 픽셀 기준으로 Widget을 배열하게 되면 Window Size를 조절할 때, Widget 은 고정된 채 여백만 늘어나는 것을 볼 수 있다. 그런 것을 생각하면 Layout을 기반으로 배치해야 하는 것이 맞으나 자유롭게 배치하기를 원하기 때문에 픽셀 기반으로 배치를 한 뒤, Window Size를 고정시키기로 했다. setFixedSize 함수를 사용한다.
픽셀 단위로 배치를 할때는 꿀팁 아닌 꿀팁이라면 그림판이나 네이버 툴즈 캡처 도구이다. Window Size를 정했다면 먼저 띄워보고 아래와 같이 배치하고자 하는 픽셀의 좌표를 확인해본다.
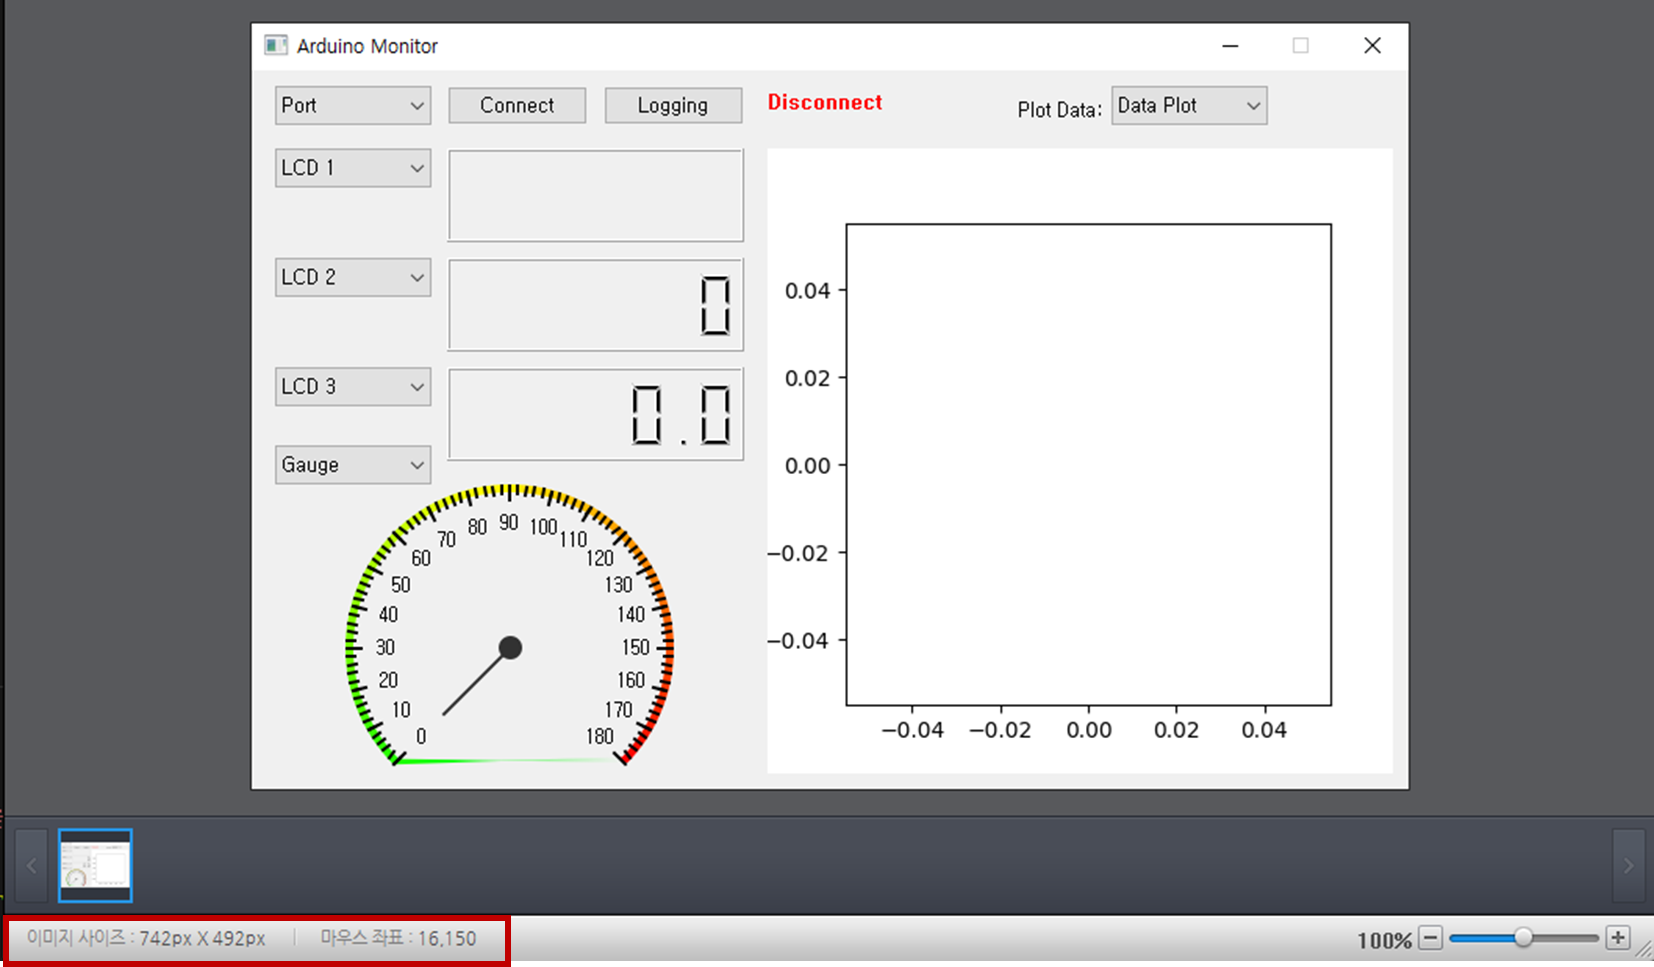
놓고자 하는 위치의 픽셀 좌표를 찍고 적어둔다. 그다음. move(x, y)나. setGeometry(x, y, width, height)를 쓴다. 그렇게 기능 구현 이전에 위젯들을 쭉 배치한 뒤에 Function을 삽입한다.
이전 UI 구상을 기반으로 어떻게 배치를 했는지 보자.
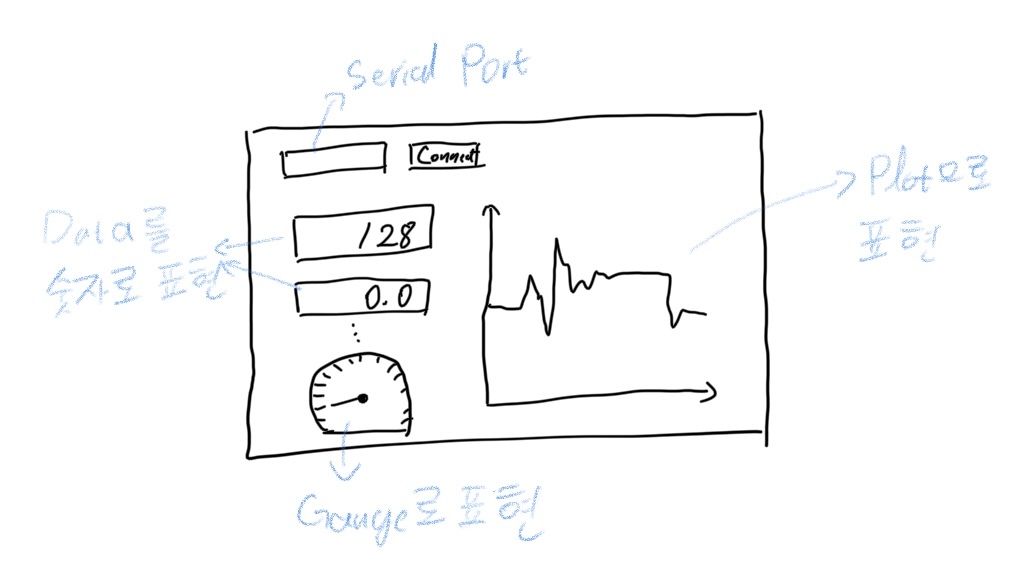
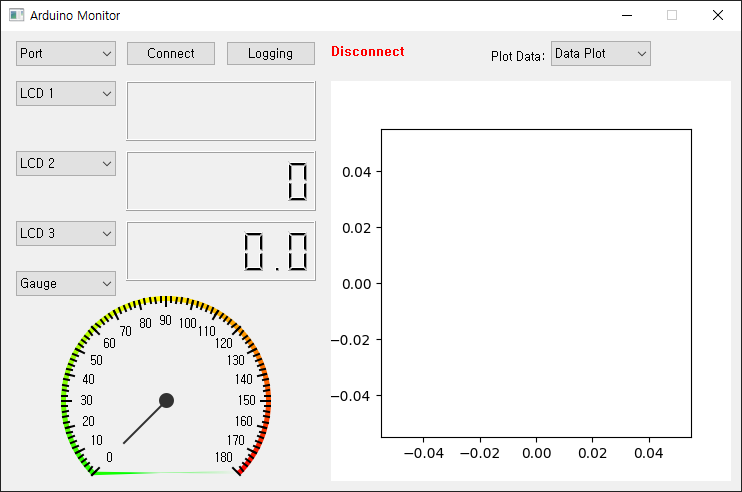
스케치와 꽤나 유사하게 구현하지 않았는가? 다른건 몰라도 게이지 하나 만들겠다고 수 많은 구글링과 한땀한땀 픽셀 계산을 했다.. 게이지를 그리면서 왜 우리는 수학시간에 원의 방정식을 배우는지 알게된다.
각설하구 이 배치를 어떻게 코드로 구현했는지 보면서 이해하자.
2. 코드 구현
def __init__(self):
        super().__init__()
        self.serialTask = None

        self.pen = QPen(QColor(0, 0, 0, 255))
        self.pen.setWidth(2)
        self.gauge_data = 0
        self.gauge_data_prev = 0

        self.scale_polygon_colors = []
        self.set_scale_polygon_colors([[.00, Qt.red],
                                     [.4, Qt.yellow],
                                     [.8, Qt.green],
                                     [1., Qt.transparent]])

        # Serial Port ComboBox #
        self.cb_port = ComboBox(self)
        self.cb_port.addItem("Port")
        self.cb_port.popupAboutToBeShown.connect(self.load_serialPort)
        self.cb_port.setGeometry(15, 10, 100, 25)


        # Connect Button #
        self.bt_connect = QPushButton('Connect', self)
        self.bt_connect.clicked.connect(self.connect_Function)
        self.bt_connect.setGeometry(125, 10, 90, 25)


        # Logging Button #
        self.bt_logging = QPushButton('Logging', self)
        self.bt_logging.clicked.connect(self.logging_Function)
        self.bt_logging.setGeometry(225, 10, 90, 25)


        # Connect State Label #
        self.lb_connect_state = QLabel('Disconnect', self)
        self.lb_connect_state.setAlignment(Qt.AlignLeft)
        self.font_lb = self.lb_connect_state.font()
        self.font_lb.setPointSize(9)
        #self.font_lb.setFamily('Times New Roman')
        self.font_lb.setBold(True)
        self.lb_connect_state.setFont(self.font_lb)
        self.lb_connect_state.setStyleSheet("color: red")
        self.lb_connect_state.setGeometry(330, 15, 90, 25)

        # LCD 1 ComboBox #
        self.cb_lcd_1 = ComboBox(self)
        self.cb_lcd_1.addItem("LCD 1")
        self.cb_lcd_1.activated[str].connect(self.select_data_lcd1)
        self.cb_lcd_1.popupAboutToBeShown.connect(self.load_DataList_lcd1)
        self.cb_lcd_1.setGeometry(15, 50, 100, 25)


        # LCD Widget 1 #
        self.lcd_1 = QLCDNumber(self)
        self.lcd_1.display('')
        self.lcd_1.setDigitCount(8)
        self.lcd_1.setGeometry(125, 50, 190, 60)


        # LCD 2 ComboBox #
        self.cb_lcd_2 = ComboBox(self)
        self.cb_lcd_2.addItem("LCD 2")
        self.cb_lcd_2.activated[str].connect(self.select_data_lcd2)
        self.cb_lcd_2.popupAboutToBeShown.connect(self.load_DataList_lcd2)
        self.cb_lcd_2.setGeometry(15, 120, 100, 25)


        # LCD Widget 2 #
        self.lcd_2 = QLCDNumber(self)
        self.lcd_2.display('0')
        self.lcd_2.setDigitCount(8)
        self.lcd_2.setGeometry(125, 120, 190, 60)


        # LCD 3 ComboBox #
        self.cb_lcd_3 = ComboBox(self)
        self.cb_lcd_3.addItem("LCD 3")
        self.cb_lcd_3.activated[str].connect(self.select_data_lcd3)
        self.cb_lcd_3.popupAboutToBeShown.connect(self.load_DataList_lcd3)
        self.cb_lcd_3.setGeometry(15, 190, 100, 25)


        # LCD Widget 3 #
        self.lcd_3 = QLCDNumber(self)
        self.lcd_3.display('0.0')
        self.lcd_3.setDigitCount(8)
        self.lcd_3.setGeometry(125, 190, 190, 60)

        # Gauge ComboBox #
        self.cb_gauge = ComboBox(self)
        self.cb_gauge.addItem("Gauge")
        self.cb_gauge.activated[str].connect(self.select_data_gauge)
        self.cb_gauge.popupAboutToBeShown.connect(self.load_DataList_gauge)
        self.cb_gauge.setGeometry(15, 240, 100, 25)

        # Data Plot Label #
        self.lb_data_plot = QLabel('Plot Data: ', self)
        self.lb_data_plot.setGeometry(490, 13, 90, 25)


        # Data Plot ComboBox #
        self.cb_data_plot = ComboBox(self)
        self.cb_data_plot.addItem("Data Plot")
        self.cb_data_plot.activated[str].connect(self.select_data_plot)
        self.cb_data_plot.popupAboutToBeShown.connect(self.load_DataList_plot)
        self.cb_data_plot.setGeometry(550, 10, 100, 25)


        # Data Plot #
        self.canvas = FigureCanvas(Figure(figsize=(4,4)))
        self.canvas.setParent(self)
        self.canvas.move(330, 50)
        #gbox.addWidget(canvas, 1, 4, 4, 4)

        self.data_plot = self.canvas.figure.subplots()
        self.x_data = []
        self.y_data = []
        self.data_plot.plot(self.x_data, self.y_data, '-')

        # x ms Timer (x는 조정 필요) #
        self.timer = QTimer(self)
        self.timer.setInterval(50)
        self.timer.timeout.connect(self.update_Data)

        self.setWindowTitle('Arduino Monitor')
        self.setFixedSize(740, 460)
        self.show()
해당 코드는 내 Github에 올라와 있으며 주소는 아래에 있다.
(사실 꽤 개발은 진행이 된 상태이다)
https://github.com/DongjinJ/Arduino_Monitor
GitHub - DongjinJ/Arduino_Monitor: 아두이노 Data를 시각화 하는 GUI
아두이노 Data를 시각화 하는 GUI. Contribute to DongjinJ/Arduino_Monitor development by creating an account on GitHub.
github.com
'프로젝트 일지 > 임베디드 모니터' 카테고리의 다른 글
| [임베디드 모니터] Arduino Demo Code 구현 (0) | 2023.04.06 |
|---|---|
| [임베디드 모니터] Serial 통신 & 데이터 무결성 - 2 (0) | 2022.01.18 |
| [임베디드 모니터] Serial 통신 & 데이터 무결성 - 1 (0) | 2021.12.14 |
| [임베디드 모니터] UI 고민 (0) | 2021.12.01 |
| [임베디드 모니터] 개발 계획 (0) | 2021.09.06 |